| 0 | 1 | 2 | 3 | 4 | 5 | 6 | 7 | 8 | |
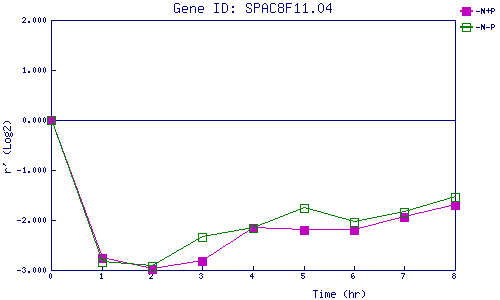
| -N+P | 0.000 | -2.750 | -2.971 | -2.824 | -2.154 | -2.209 | -2.203 | -1.942 | -1.696 |
| -N-P | 0.000 | -2.839 | -2.926 | -2.345 | -2.168 | -1.770 | -2.047 | -1.842 | -1.547 |
|
-N+P: Nitrogen starved in the presence of P-factor -N-P: Nitrogen starved in the absence of P-factor |