| 0 | 1 | 2 | 3 | 4 | 5 | 6 | 7 | 8 | |
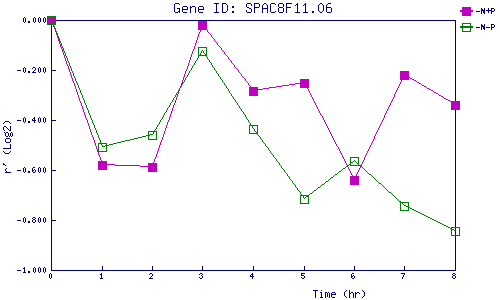
| -N+P | 0.000 | -0.580 | -0.589 | -0.020 | -0.283 | -0.253 | -0.640 | -0.221 | -0.341 |
| -N-P | 0.000 | -0.507 | -0.461 | -0.125 | -0.437 | -0.715 | -0.563 | -0.745 | -0.845 |
|
-N+P: Nitrogen starved in the presence of P-factor -N-P: Nitrogen starved in the absence of P-factor |