cdc24
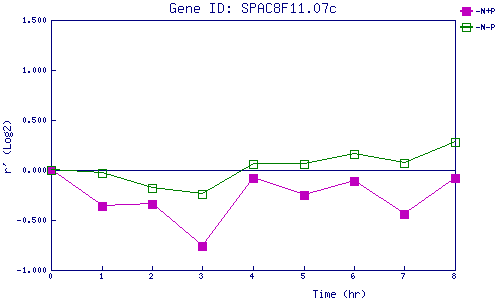
| 0 | 1 | 2 | 3 | 4 | 5 | 6 | 7 | 8 | |
| -N+P | 0.000 | -0.357 | -0.343 | -0.758 | -0.079 | -0.254 | -0.111 | -0.440 | -0.079 |
| -N-P | 0.000 | -0.030 | -0.185 | -0.239 | 0.061 | 0.055 | 0.165 | 0.068 | 0.283 |
|
-N+P: Nitrogen starved in the presence of P-factor -N-P: Nitrogen starved in the absence of P-factor |