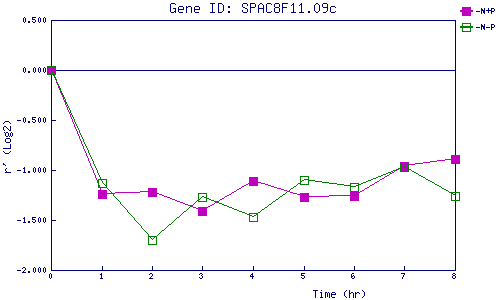
| 0 | 1 | 2 | 3 | 4 | 5 | 6 | 7 | 8 | |
| -N+P | 0.000 | -1.240 | -1.218 | -1.412 | -1.109 | -1.268 | -1.264 | -0.963 | -0.892 |
| -N-P | 0.000 | -1.129 | -1.699 | -1.269 | -1.471 | -1.103 | -1.169 | -0.969 | -1.258 |
|
-N+P: Nitrogen starved in the presence of P-factor -N-P: Nitrogen starved in the absence of P-factor |