| 0 | 1 | 2 | 3 | 4 | 5 | 6 | 7 | 8 | |
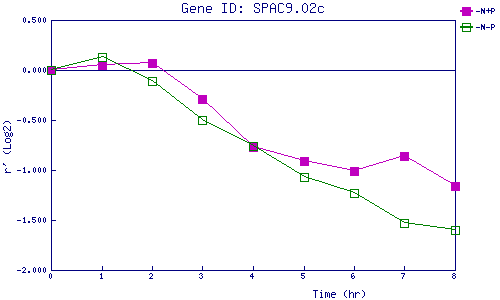
| -N+P | 0.000 | 0.048 | 0.074 | -0.288 | -0.773 | -0.910 | -1.009 | -0.861 | -1.157 |
| -N-P | 0.000 | 0.133 | -0.110 | -0.498 | -0.765 | -1.070 | -1.227 | -1.527 | -1.597 |
|
-N+P: Nitrogen starved in the presence of P-factor -N-P: Nitrogen starved in the absence of P-factor |