brr2 Tf2-1
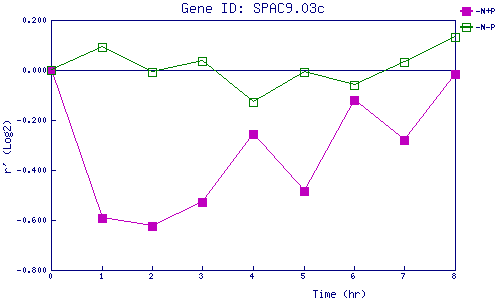
| 0 | 1 | 2 | 3 | 4 | 5 | 6 | 7 | 8 | |
| -N+P | 0.000 | -0.591 | -0.623 | -0.526 | -0.254 | -0.485 | -0.120 | -0.279 | -0.016 |
| -N-P | 0.000 | 0.093 | -0.006 | 0.035 | -0.126 | -0.008 | -0.061 | 0.034 | 0.132 |
|
-N+P: Nitrogen starved in the presence of P-factor -N-P: Nitrogen starved in the absence of P-factor |