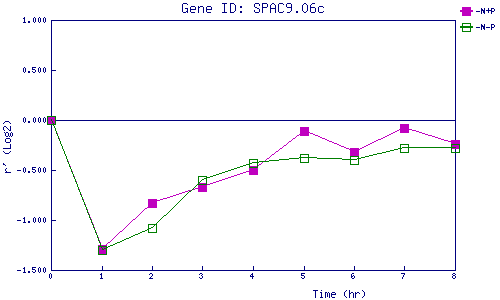
| 0 | 1 | 2 | 3 | 4 | 5 | 6 | 7 | 8 | |
| -N+P | 0.000 | -1.288 | -0.829 | -0.671 | -0.495 | -0.110 | -0.320 | -0.076 | -0.237 |
| -N-P | 0.000 | -1.301 | -1.082 | -0.595 | -0.433 | -0.379 | -0.398 | -0.282 | -0.276 |
|
-N+P: Nitrogen starved in the presence of P-factor -N-P: Nitrogen starved in the absence of P-factor |