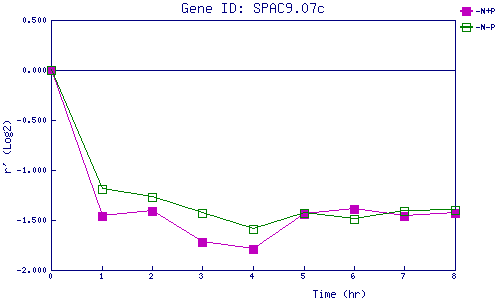
| 0 | 1 | 2 | 3 | 4 | 5 | 6 | 7 | 8 | |
| -N+P | 0.000 | -1.457 | -1.410 | -1.725 | -1.792 | -1.444 | -1.394 | -1.455 | -1.430 |
| -N-P | 0.000 | -1.190 | -1.273 | -1.431 | -1.593 | -1.428 | -1.494 | -1.407 | -1.397 |
|
-N+P: Nitrogen starved in the presence of P-factor -N-P: Nitrogen starved in the absence of P-factor |