| 0 | 1 | 2 | 3 | 4 | 5 | 6 | 7 | 8 | |
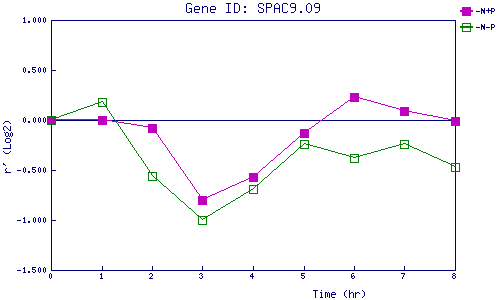
| -N+P | 0.000 | -0.005 | -0.080 | -0.799 | -0.574 | -0.128 | 0.228 | 0.090 | -0.006 |
| -N-P | 0.000 | 0.178 | -0.559 | -1.002 | -0.686 | -0.236 | -0.382 | -0.242 | -0.470 |
|
-N+P: Nitrogen starved in the presence of P-factor -N-P: Nitrogen starved in the absence of P-factor |