atp12
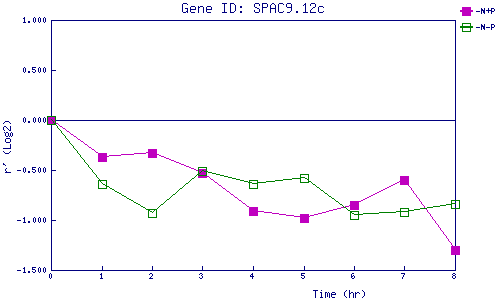
| 0 | 1 | 2 | 3 | 4 | 5 | 6 | 7 | 8 | |
| -N+P | 0.000 | -0.371 | -0.332 | -0.529 | -0.906 | -0.982 | -0.852 | -0.602 | -1.301 |
| -N-P | 0.000 | -0.636 | -0.929 | -0.511 | -0.635 | -0.580 | -0.950 | -0.920 | -0.842 |
|
-N+P: Nitrogen starved in the presence of P-factor -N-P: Nitrogen starved in the absence of P-factor |