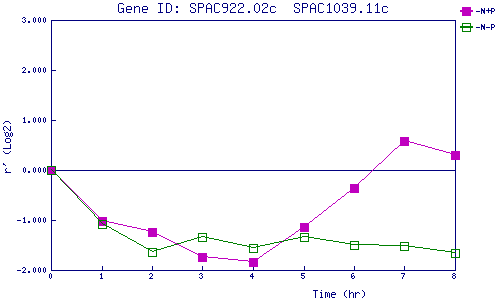
| 0 | 1 | 2 | 3 | 4 | 5 | 6 | 7 | 8 | |
| -N+P | 0.000 | -1.016 | -1.250 | -1.749 | -1.833 | -1.147 | -0.369 | 0.588 | 0.294 |
| -N-P | 0.000 | -1.083 | -1.641 | -1.348 | -1.568 | -1.338 | -1.492 | -1.513 | -1.653 |
|
-N+P: Nitrogen starved in the presence of P-factor -N-P: Nitrogen starved in the absence of P-factor |