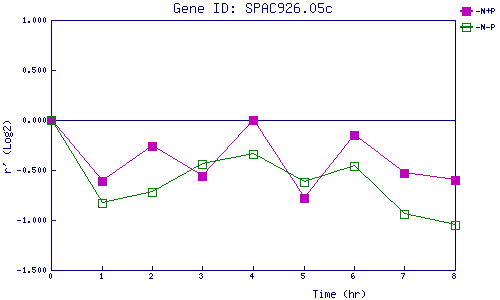
| 0 | 1 | 2 | 3 | 4 | 5 | 6 | 7 | 8 | |
| -N+P | 0.000 | -0.612 | -0.264 | -0.556 | 0.000 | -0.785 | -0.151 | -0.531 | -0.604 |
| -N-P | 0.000 | -0.831 | -0.722 | -0.436 | -0.344 | -0.620 | -0.456 | -0.938 | -1.051 |
|
-N+P: Nitrogen starved in the presence of P-factor -N-P: Nitrogen starved in the absence of P-factor |