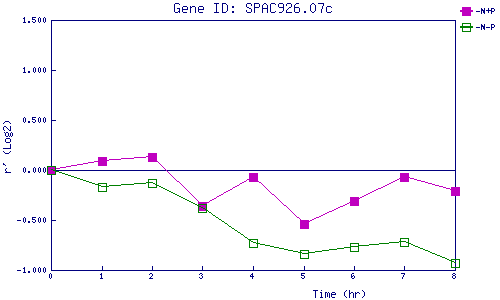
| 0 | 1 | 2 | 3 | 4 | 5 | 6 | 7 | 8 | |
| -N+P | 0.000 | 0.091 | 0.131 | -0.356 | -0.071 | -0.545 | -0.311 | -0.069 | -0.207 |
| -N-P | 0.000 | -0.168 | -0.133 | -0.379 | -0.728 | -0.845 | -0.770 | -0.724 | -0.933 |
|
-N+P: Nitrogen starved in the presence of P-factor -N-P: Nitrogen starved in the absence of P-factor |