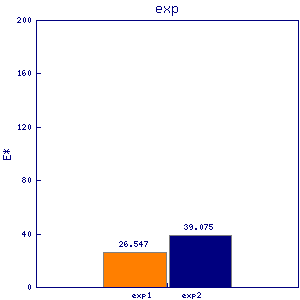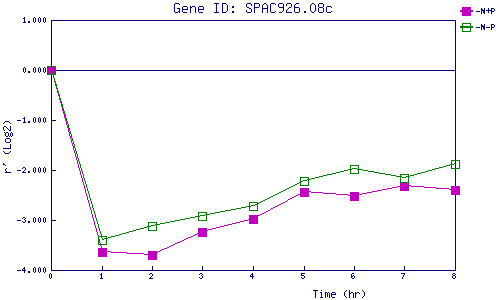
| 0 | 1 | 2 | 3 | 4 | 5 | 6 | 7 | 8 | |
| -N+P | 0.000 | -3.646 | -3.701 | -3.233 | -2.978 | -2.441 | -2.513 | -2.330 | -2.400 |
| -N-P | 0.000 | -3.396 | -3.124 | -2.920 | -2.712 | -2.227 | -1.984 | -2.166 | -1.878 |
|
-N+P: Nitrogen starved in the presence of P-factor -N-P: Nitrogen starved in the absence of P-factor |