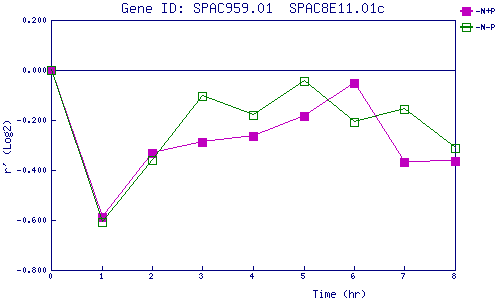
| 0 | 1 | 2 | 3 | 4 | 5 | 6 | 7 | 8 | |
| -N+P | 0.000 | -0.588 | -0.331 | -0.287 | -0.264 | -0.186 | -0.053 | -0.369 | -0.364 |
| -N-P | 0.000 | -0.610 | -0.360 | -0.103 | -0.181 | -0.045 | -0.206 | -0.156 | -0.313 |
|
-N+P: Nitrogen starved in the presence of P-factor -N-P: Nitrogen starved in the absence of P-factor |