| 0 | 1 | 2 | 3 | 4 | 5 | 6 | 7 | 8 | |
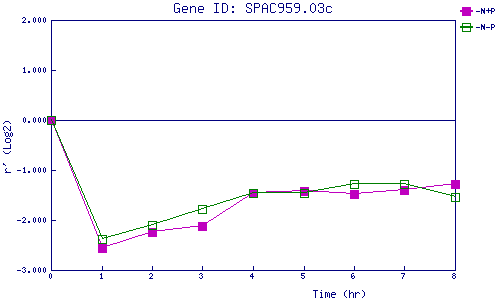
| -N+P | 0.000 | -2.562 | -2.248 | -2.118 | -1.461 | -1.412 | -1.478 | -1.401 | -1.287 |
| -N-P | 0.000 | -2.375 | -2.095 | -1.773 | -1.462 | -1.452 | -1.289 | -1.289 | -1.543 |
|
-N+P: Nitrogen starved in the presence of P-factor -N-P: Nitrogen starved in the absence of P-factor |