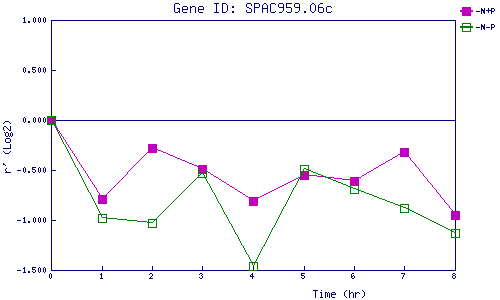
| 0 | 1 | 2 | 3 | 4 | 5 | 6 | 7 | 8 | |
| -N+P | 0.000 | -0.790 | -0.282 | -0.487 | -0.814 | -0.549 | -0.606 | -0.325 | -0.953 |
| -N-P | 0.000 | -0.983 | -1.029 | -0.531 | -1.456 | -0.490 | -0.690 | -0.875 | -1.126 |
|
-N+P: Nitrogen starved in the presence of P-factor -N-P: Nitrogen starved in the absence of P-factor |