rpl21-2 rpl2102 rpl21
| 0 | 1 | 2 | 3 | 4 | 5 | 6 | 7 | 8 | |
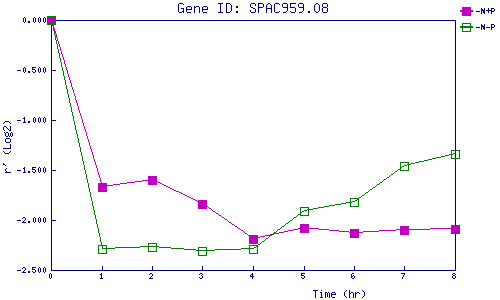
| -N+P | 0.000 | -1.673 | -1.601 | -1.836 | -2.186 | -2.080 | -2.132 | -2.097 | -2.090 |
| -N-P | 0.000 | -2.291 | -2.274 | -2.308 | -2.287 | -1.907 | -1.815 | -1.463 | -1.344 |
|
-N+P: Nitrogen starved in the presence of P-factor -N-P: Nitrogen starved in the absence of P-factor |