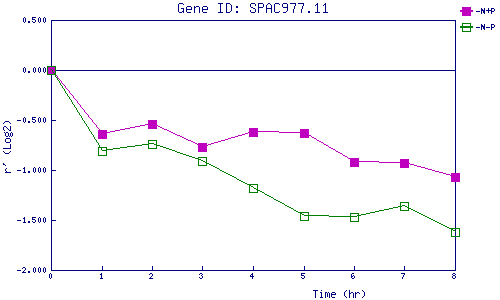
| 0 | 1 | 2 | 3 | 4 | 5 | 6 | 7 | 8 | |
| -N+P | 0.000 | -0.645 | -0.535 | -0.770 | -0.615 | -0.632 | -0.918 | -0.933 | -1.073 |
| -N-P | 0.000 | -0.807 | -0.739 | -0.909 | -1.180 | -1.461 | -1.467 | -1.357 | -1.615 |
|
-N+P: Nitrogen starved in the presence of P-factor -N-P: Nitrogen starved in the absence of P-factor |