| 0 | 1 | 2 | 3 | 4 | 5 | 6 | 7 | 8 | |
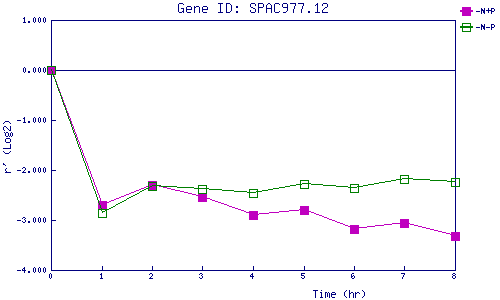
| -N+P | 0.000 | -2.706 | -2.307 | -2.548 | -2.897 | -2.793 | -3.182 | -3.053 | -3.320 |
| -N-P | 0.000 | -2.857 | -2.313 | -2.388 | -2.462 | -2.277 | -2.355 | -2.177 | -2.234 |
|
-N+P: Nitrogen starved in the presence of P-factor -N-P: Nitrogen starved in the absence of P-factor |