| 0 | 1 | 2 | 3 | 4 | 5 | 6 | 7 | 8 | |
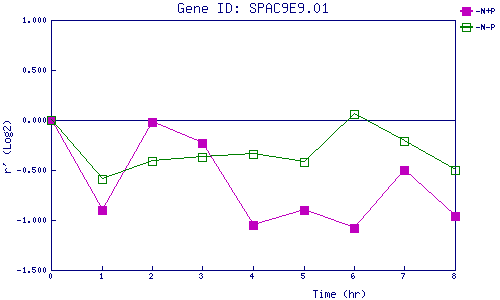
| -N+P | 0.000 | -0.897 | -0.023 | -0.231 | -1.051 | -0.897 | -1.084 | -0.502 | -0.956 |
| -N-P | 0.000 | -0.587 | -0.408 | -0.366 | -0.343 | -0.415 | 0.062 | -0.206 | -0.503 |
|
-N+P: Nitrogen starved in the presence of P-factor -N-P: Nitrogen starved in the absence of P-factor |