leu2
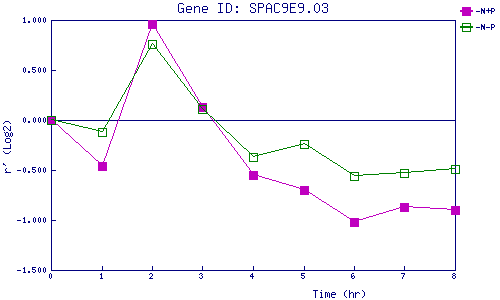
| 0 | 1 | 2 | 3 | 4 | 5 | 6 | 7 | 8 | |
| -N+P | 0.000 | -0.455 | 0.956 | 0.132 | -0.553 | -0.702 | -1.019 | -0.873 | -0.900 |
| -N-P | 0.000 | -0.119 | 0.761 | 0.108 | -0.366 | -0.238 | -0.556 | -0.533 | -0.487 |
|
-N+P: Nitrogen starved in the presence of P-factor -N-P: Nitrogen starved in the absence of P-factor |