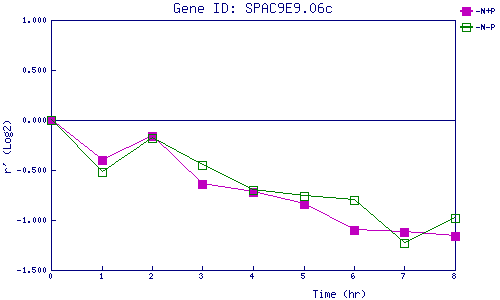
| 0 | 1 | 2 | 3 | 4 | 5 | 6 | 7 | 8 | |
| -N+P | 0.000 | -0.402 | -0.158 | -0.644 | -0.721 | -0.841 | -1.099 | -1.124 | -1.155 |
| -N-P | 0.000 | -0.522 | -0.179 | -0.454 | -0.695 | -0.760 | -0.805 | -1.227 | -0.976 |
|
-N+P: Nitrogen starved in the presence of P-factor -N-P: Nitrogen starved in the absence of P-factor |