wos2
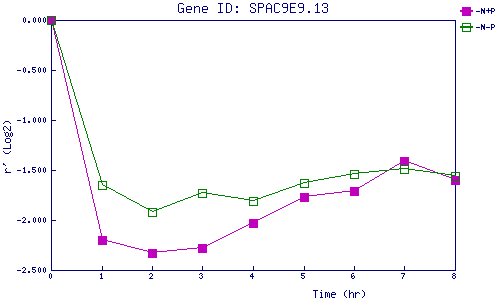
| 0 | 1 | 2 | 3 | 4 | 5 | 6 | 7 | 8 | |
| -N+P | 0.000 | -2.197 | -2.334 | -2.275 | -2.030 | -1.766 | -1.710 | -1.406 | -1.599 |
| -N-P | 0.000 | -1.648 | -1.915 | -1.727 | -1.812 | -1.634 | -1.543 | -1.494 | -1.555 |
|
-N+P: Nitrogen starved in the presence of P-factor -N-P: Nitrogen starved in the absence of P-factor |