vps24
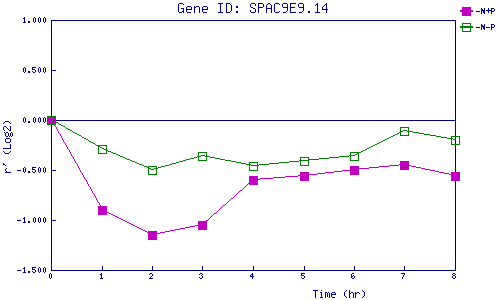
| 0 | 1 | 2 | 3 | 4 | 5 | 6 | 7 | 8 | |
| -N+P | 0.000 | -0.895 | -1.148 | -1.046 | -0.597 | -0.557 | -0.501 | -0.452 | -0.558 |
| -N-P | 0.000 | -0.288 | -0.498 | -0.359 | -0.455 | -0.408 | -0.355 | -0.113 | -0.204 |
|
-N+P: Nitrogen starved in the presence of P-factor -N-P: Nitrogen starved in the absence of P-factor |