wis4 wak1 wik1
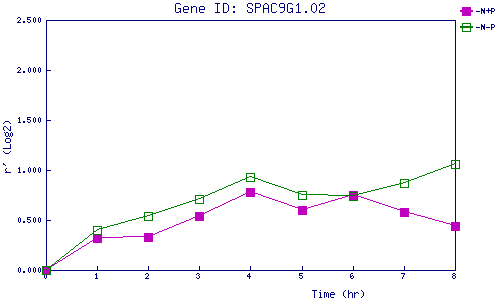
| 0 | 1 | 2 | 3 | 4 | 5 | 6 | 7 | 8 | |
| -N+P | 0.000 | 0.324 | 0.334 | 0.536 | 0.779 | 0.604 | 0.754 | 0.576 | 0.443 |
| -N-P | 0.000 | 0.401 | 0.536 | 0.713 | 0.932 | 0.753 | 0.735 | 0.873 | 1.055 |
|
-N+P: Nitrogen starved in the presence of P-factor -N-P: Nitrogen starved in the absence of P-factor |