rpl30 rpl30-1 rpl3001
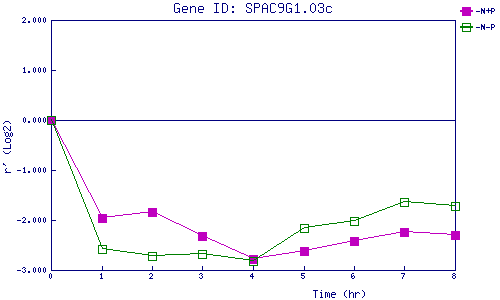
| 0 | 1 | 2 | 3 | 4 | 5 | 6 | 7 | 8 | |
| -N+P | 0.000 | -1.955 | -1.850 | -2.327 | -2.781 | -2.627 | -2.412 | -2.248 | -2.299 |
| -N-P | 0.000 | -2.578 | -2.711 | -2.670 | -2.824 | -2.156 | -2.018 | -1.635 | -1.710 |
|
-N+P: Nitrogen starved in the presence of P-factor -N-P: Nitrogen starved in the absence of P-factor |