oxa1 oxa101 oxa1-1 cox18 oxa1sp1
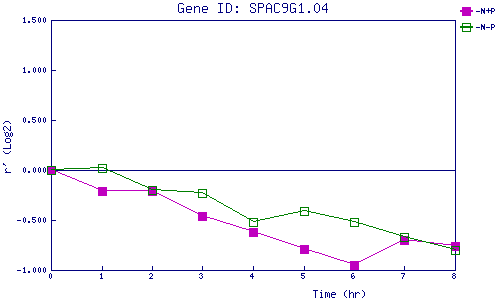
| 0 | 1 | 2 | 3 | 4 | 5 | 6 | 7 | 8 | |
| -N+P | 0.000 | -0.207 | -0.208 | -0.463 | -0.621 | -0.790 | -0.946 | -0.697 | -0.759 |
| -N-P | 0.000 | 0.015 | -0.197 | -0.232 | -0.515 | -0.414 | -0.519 | -0.670 | -0.796 |
|
-N+P: Nitrogen starved in the presence of P-factor -N-P: Nitrogen starved in the absence of P-factor |