spn4
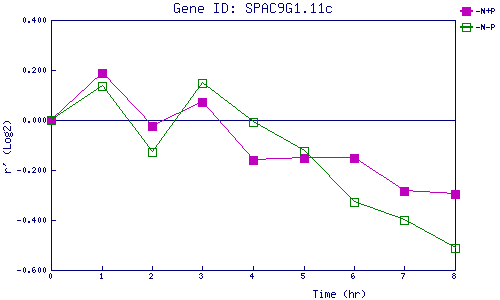
| 0 | 1 | 2 | 3 | 4 | 5 | 6 | 7 | 8 | |
| -N+P | 0.000 | 0.187 | -0.025 | 0.072 | -0.159 | -0.151 | -0.152 | -0.283 | -0.294 |
| -N-P | 0.000 | 0.138 | -0.127 | 0.147 | -0.007 | -0.124 | -0.330 | -0.401 | -0.513 |
|
-N+P: Nitrogen starved in the presence of P-factor -N-P: Nitrogen starved in the absence of P-factor |