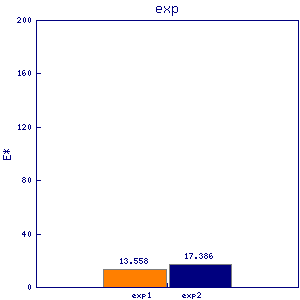
cpd1
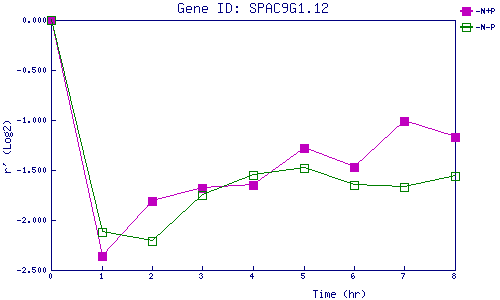
| 0 | 1 | 2 | 3 | 4 | 5 | 6 | 7 | 8 | |
| -N+P | 0.000 | -2.360 | -1.808 | -1.676 | -1.651 | -1.285 | -1.466 | -1.015 | -1.173 |
| -N-P | 0.000 | -2.120 | -2.212 | -1.753 | -1.548 | -1.481 | -1.652 | -1.669 | -1.555 |
|
-N+P: Nitrogen starved in the presence of P-factor -N-P: Nitrogen starved in the absence of P-factor |