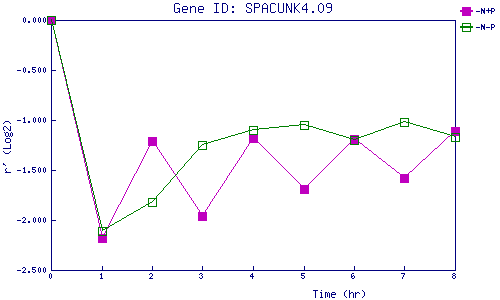
| 0 | 1 | 2 | 3 | 4 | 5 | 6 | 7 | 8 | |
| -N+P | 0.000 | -2.184 | -1.208 | -1.958 | -1.179 | -1.687 | -1.187 | -1.582 | -1.106 |
| -N-P | 0.000 | -2.107 | -1.816 | -1.253 | -1.099 | -1.051 | -1.205 | -1.023 | -1.173 |
|
-N+P: Nitrogen starved in the presence of P-factor -N-P: Nitrogen starved in the absence of P-factor |