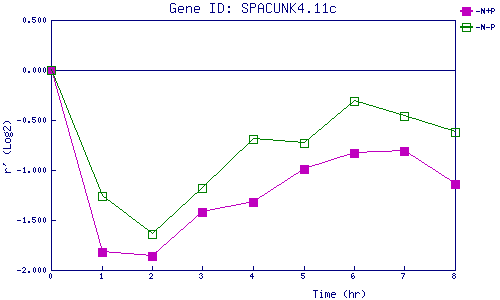
| 0 | 1 | 2 | 3 | 4 | 5 | 6 | 7 | 8 | |
| -N+P | 0.000 | -1.825 | -1.858 | -1.422 | -1.318 | -0.988 | -0.827 | -0.812 | -1.135 |
| -N-P | 0.000 | -1.257 | -1.640 | -1.183 | -0.690 | -0.734 | -0.312 | -0.459 | -0.624 |
|
-N+P: Nitrogen starved in the presence of P-factor -N-P: Nitrogen starved in the absence of P-factor |