bos1
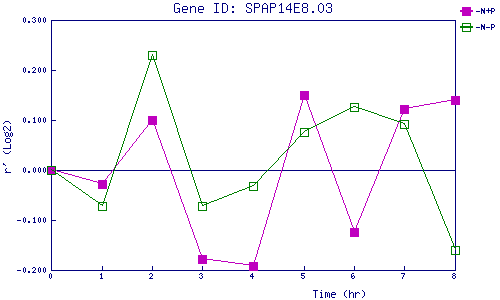
| 0 | 1 | 2 | 3 | 4 | 5 | 6 | 7 | 8 | |
| -N+P | 0.000 | -0.027 | 0.100 | -0.178 | -0.191 | 0.150 | -0.123 | 0.122 | 0.140 |
| -N-P | 0.000 | -0.073 | 0.230 | -0.071 | -0.031 | 0.076 | 0.126 | 0.091 | -0.160 |
|
-N+P: Nitrogen starved in the presence of P-factor -N-P: Nitrogen starved in the absence of P-factor |