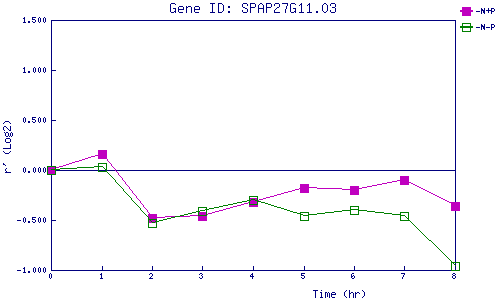
| 0 | 1 | 2 | 3 | 4 | 5 | 6 | 7 | 8 | |
| -N+P | 0.000 | 0.165 | -0.483 | -0.462 | -0.319 | -0.183 | -0.202 | -0.101 | -0.358 |
| -N-P | 0.000 | 0.031 | -0.529 | -0.406 | -0.305 | -0.462 | -0.395 | -0.457 | -0.962 |
|
-N+P: Nitrogen starved in the presence of P-factor -N-P: Nitrogen starved in the absence of P-factor |