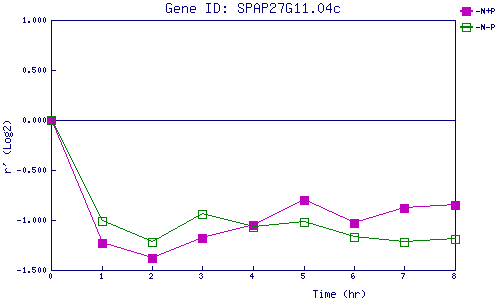
| 0 | 1 | 2 | 3 | 4 | 5 | 6 | 7 | 8 | |
| -N+P | 0.000 | -1.235 | -1.384 | -1.180 | -1.050 | -0.800 | -1.030 | -0.880 | -0.848 |
| -N-P | 0.000 | -1.007 | -1.225 | -0.939 | -1.067 | -1.022 | -1.168 | -1.223 | -1.189 |
|
-N+P: Nitrogen starved in the presence of P-factor -N-P: Nitrogen starved in the absence of P-factor |