vps41
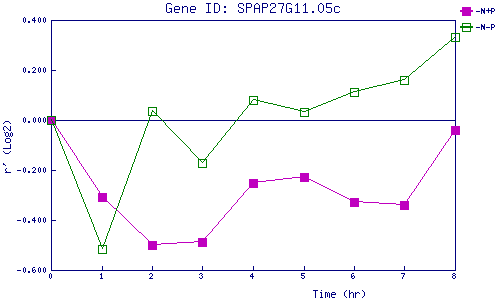
| 0 | 1 | 2 | 3 | 4 | 5 | 6 | 7 | 8 | |
| -N+P | 0.000 | -0.309 | -0.501 | -0.488 | -0.253 | -0.228 | -0.327 | -0.339 | -0.038 |
| -N-P | 0.000 | -0.517 | 0.036 | -0.171 | 0.082 | 0.034 | 0.110 | 0.162 | 0.332 |
|
-N+P: Nitrogen starved in the presence of P-factor -N-P: Nitrogen starved in the absence of P-factor |