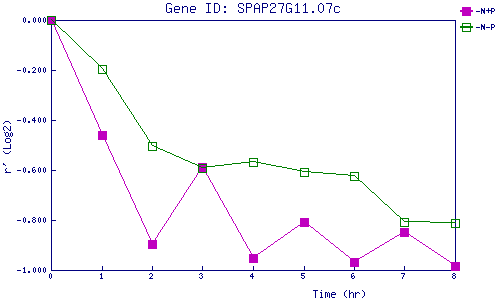
| 0 | 1 | 2 | 3 | 4 | 5 | 6 | 7 | 8 | |
| -N+P | 0.000 | -0.460 | -0.898 | -0.587 | -0.953 | -0.809 | -0.967 | -0.850 | -0.984 |
| -N-P | 0.000 | -0.196 | -0.506 | -0.592 | -0.570 | -0.607 | -0.624 | -0.808 | -0.812 |
|
-N+P: Nitrogen starved in the presence of P-factor -N-P: Nitrogen starved in the absence of P-factor |