| 0 | 1 | 2 | 3 | 4 | 5 | 6 | 7 | 8 | |
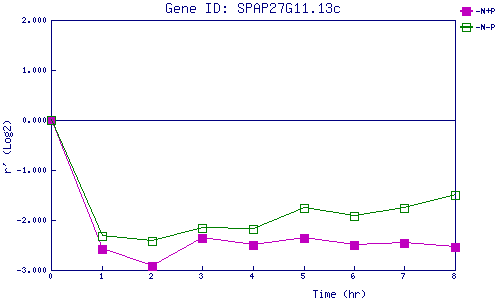
| -N+P | 0.000 | -2.582 | -2.926 | -2.351 | -2.497 | -2.363 | -2.504 | -2.460 | -2.540 |
| -N-P | 0.000 | -2.318 | -2.414 | -2.159 | -2.181 | -1.765 | -1.929 | -1.750 | -1.501 |
|
-N+P: Nitrogen starved in the presence of P-factor -N-P: Nitrogen starved in the absence of P-factor |