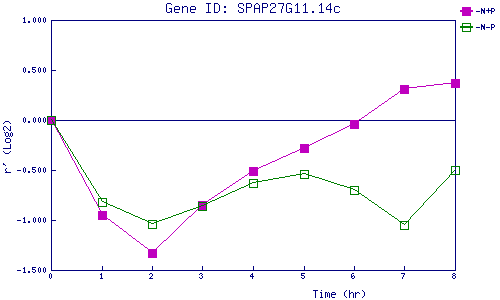
| 0 | 1 | 2 | 3 | 4 | 5 | 6 | 7 | 8 | |
| -N+P | 0.000 | -0.950 | -1.328 | -0.853 | -0.508 | -0.285 | -0.038 | 0.313 | 0.366 |
| -N-P | 0.000 | -0.815 | -1.040 | -0.862 | -0.626 | -0.536 | -0.701 | -1.047 | -0.499 |
|
-N+P: Nitrogen starved in the presence of P-factor -N-P: Nitrogen starved in the absence of P-factor |