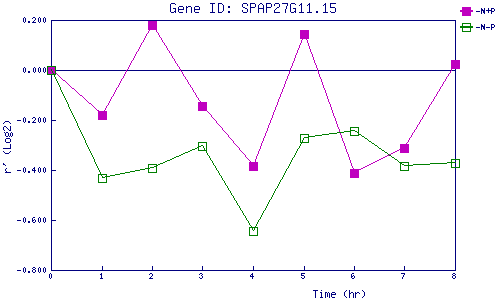
| 0 | 1 | 2 | 3 | 4 | 5 | 6 | 7 | 8 | |
| -N+P | 0.000 | -0.181 | 0.180 | -0.143 | -0.383 | 0.142 | -0.412 | -0.311 | 0.024 |
| -N-P | 0.000 | -0.430 | -0.391 | -0.303 | -0.645 | -0.273 | -0.244 | -0.385 | -0.372 |
|
-N+P: Nitrogen starved in the presence of P-factor -N-P: Nitrogen starved in the absence of P-factor |