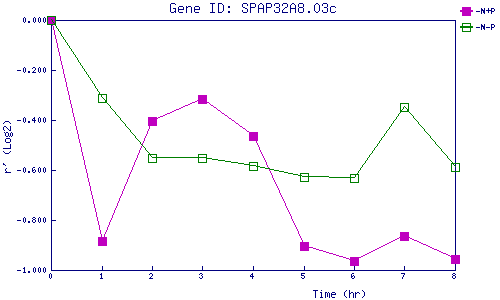
| 0 | 1 | 2 | 3 | 4 | 5 | 6 | 7 | 8 | |
| -N+P | 0.000 | -0.885 | -0.405 | -0.316 | -0.463 | -0.905 | -0.964 | -0.864 | -0.955 |
| -N-P | 0.000 | -0.312 | -0.552 | -0.550 | -0.584 | -0.627 | -0.633 | -0.349 | -0.589 |
|
-N+P: Nitrogen starved in the presence of P-factor -N-P: Nitrogen starved in the absence of P-factor |