| 0 | 1 | 2 | 3 | 4 | 5 | 6 | 7 | 8 | |
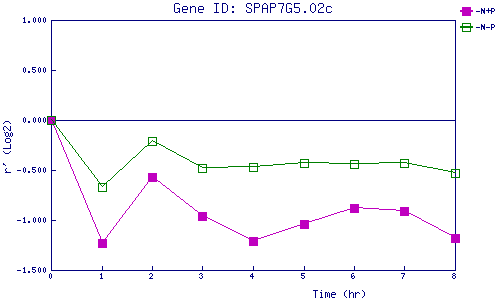
| -N+P | 0.000 | -1.233 | -0.573 | -0.960 | -1.208 | -1.036 | -0.876 | -0.906 | -1.181 |
| -N-P | 0.000 | -0.667 | -0.214 | -0.483 | -0.474 | -0.434 | -0.438 | -0.434 | -0.533 |
|
-N+P: Nitrogen starved in the presence of P-factor -N-P: Nitrogen starved in the absence of P-factor |