rpl22
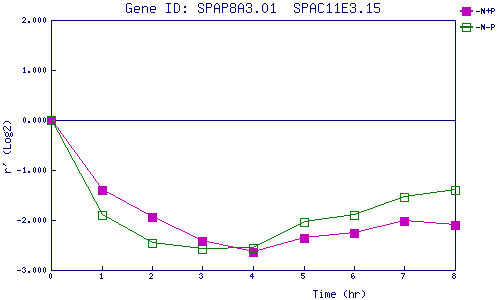
| 0 | 1 | 2 | 3 | 4 | 5 | 6 | 7 | 8 | |
| -N+P | 0.000 | -1.400 | -1.937 | -2.425 | -2.638 | -2.351 | -2.268 | -2.030 | -2.091 |
| -N-P | 0.000 | -1.898 | -2.462 | -2.583 | -2.570 | -2.037 | -1.903 | -1.542 | -1.402 |
|
-N+P: Nitrogen starved in the presence of P-factor -N-P: Nitrogen starved in the absence of P-factor |