| 0 | 1 | 2 | 3 | 4 | 5 | 6 | 7 | 8 | |
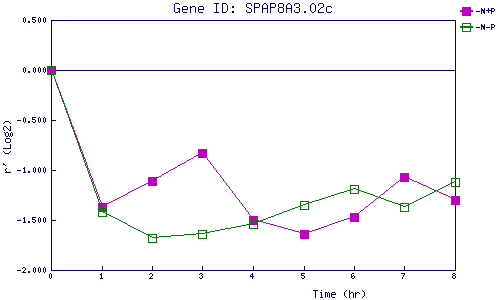
| -N+P | 0.000 | -1.366 | -1.110 | -0.830 | -1.500 | -1.640 | -1.469 | -1.067 | -1.296 |
| -N-P | 0.000 | -1.424 | -1.685 | -1.635 | -1.539 | -1.350 | -1.186 | -1.373 | -1.119 |
|
-N+P: Nitrogen starved in the presence of P-factor -N-P: Nitrogen starved in the absence of P-factor |