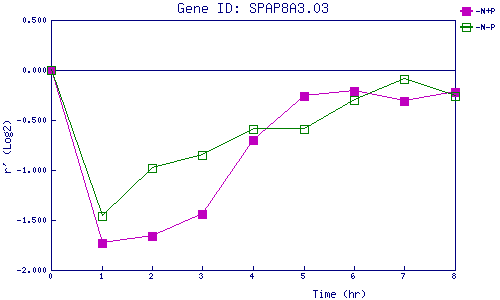
| 0 | 1 | 2 | 3 | 4 | 5 | 6 | 7 | 8 | |
| -N+P | 0.000 | -1.731 | -1.661 | -1.435 | -0.705 | -0.256 | -0.211 | -0.313 | -0.216 |
| -N-P | 0.000 | -1.455 | -0.983 | -0.847 | -0.586 | -0.593 | -0.302 | -0.092 | -0.258 |
|
-N+P: Nitrogen starved in the presence of P-factor -N-P: Nitrogen starved in the absence of P-factor |