| 0 | 1 | 2 | 3 | 4 | 5 | 6 | 7 | 8 | |
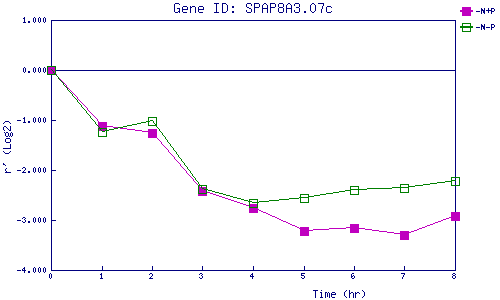
| -N+P | 0.000 | -1.126 | -1.255 | -2.426 | -2.752 | -3.225 | -3.166 | -3.301 | -2.922 |
| -N-P | 0.000 | -1.242 | -1.026 | -2.378 | -2.657 | -2.553 | -2.403 | -2.354 | -2.222 |
|
-N+P: Nitrogen starved in the presence of P-factor -N-P: Nitrogen starved in the absence of P-factor |