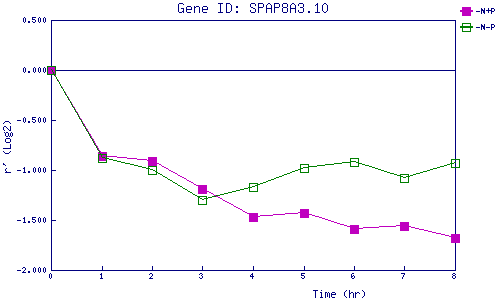
| 0 | 1 | 2 | 3 | 4 | 5 | 6 | 7 | 8 | |
| -N+P | 0.000 | -0.856 | -0.910 | -1.190 | -1.472 | -1.432 | -1.587 | -1.558 | -1.684 |
| -N-P | 0.000 | -0.882 | -1.004 | -1.295 | -1.169 | -0.975 | -0.920 | -1.079 | -0.931 |
|
-N+P: Nitrogen starved in the presence of P-factor -N-P: Nitrogen starved in the absence of P-factor |