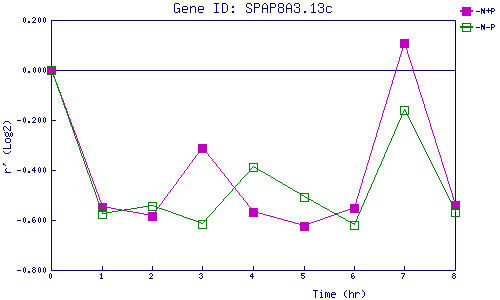
| 0 | 1 | 2 | 3 | 4 | 5 | 6 | 7 | 8 | |
| -N+P | 0.000 | -0.548 | -0.585 | -0.310 | -0.569 | -0.625 | -0.551 | 0.107 | -0.539 |
| -N-P | 0.000 | -0.578 | -0.542 | -0.618 | -0.387 | -0.507 | -0.621 | -0.158 | -0.566 |
|
-N+P: Nitrogen starved in the presence of P-factor -N-P: Nitrogen starved in the absence of P-factor |