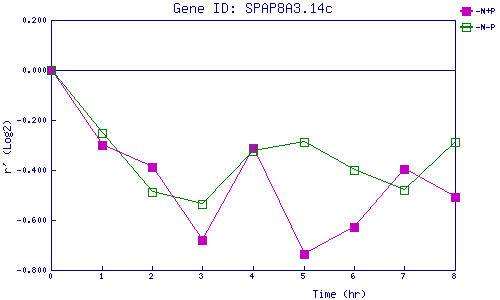
| 0 | 1 | 2 | 3 | 4 | 5 | 6 | 7 | 8 | |
| -N+P | 0.000 | -0.301 | -0.389 | -0.678 | -0.310 | -0.735 | -0.628 | -0.396 | -0.508 |
| -N-P | 0.000 | -0.252 | -0.490 | -0.538 | -0.325 | -0.287 | -0.399 | -0.482 | -0.288 |
|
-N+P: Nitrogen starved in the presence of P-factor -N-P: Nitrogen starved in the absence of P-factor |