sec71 sec7a
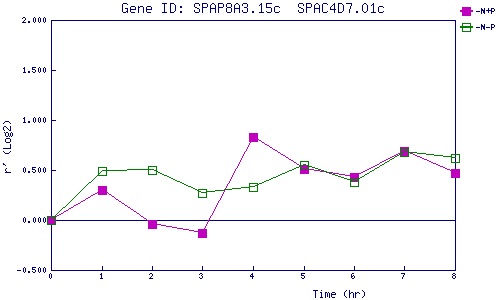
| 0 | 1 | 2 | 3 | 4 | 5 | 6 | 7 | 8 | |
| -N+P | 0.000 | 0.304 | -0.039 | -0.129 | 0.829 | 0.512 | 0.428 | 0.686 | 0.468 |
| -N-P | 0.000 | 0.490 | 0.496 | 0.269 | 0.331 | 0.550 | 0.375 | 0.682 | 0.623 |
|
-N+P: Nitrogen starved in the presence of P-factor -N-P: Nitrogen starved in the absence of P-factor |